The Beginning of a Change: Travel and Covid-19
The COVID-19 pandemic significantly altered travel patterns across the United States, highlighting an intersection of public health policies and individual behaviors in shaping mobility trends like never before. This project examines the interplay between state policies, public compliance, and travel behavior during the pandemic. Our goal is to reveal the practical implications of policies and the choices people made in the face of a global crisis through our research questions.
Our Questions
What is the relationship between COVID-19 cases and travel, especially through the lens of California and Florida?
What do these relationships reveal about state-level policy responses and the human story of Covid and Travel?
The Timeline
The pandemic turned the world of travel upside down, reshaping the notion of how and where people move. Across the United States, public health concerns and government policies played a massive role in determining travel behaviors.
California and Florida are two of the nation’s most popular travel hotspots and adopted dramatically different strategies. California adopted strict shelter-in-place orders, placing public health as its top priority. In contrast, Florida took a more relaxed approach, focusing on keeping its economy running. These choices reflected deeper political and cultural divides and led to unique outcomes in mobility and tourism. The stark contrast in their strategies raises a fascinating question: How did these divergent policies shape travel behaviors and the spread of COVID-19? Taking a closer look at the defining moments and key decisions in California and Florida’s pandemic responses reveal how their contrasting approaches shaped outcomes for public health and travel.
A Comparison of California’s and Florida’s Travel Rates
It was clear that California and Florida took different approaches to mitigate public health hazards while maintaining their economies, but how exactly did their different approaches impact their travel rates during the pandemic?
California and Florida Show Similar Travel Recovery Patterns and Trip Length Distributions During the Pandemic, but Diverging Amounts per Capita.
The graph to the right illustrates the average number of trips taken across different trip length categories in California (CA) and Florida (FL) from 2020 to 2023. The height of each bar represents the total number of trips per year, while the colored segments of each bar represent the proportion of trips by distance category. Very few trips, relatively speaking, are over 50 miles in length, so this graph highlights the trends in the number of short trips taken, while the segments representing longer trips that would include vacation travel are not as visible.

A notable pattern emerges through this data in the context of the COVID-19 pandemic: in 2020, during the height of the pandemic and widespread lockdowns, (Jacobson et al. 2020) the overall number of trips across all categories was significantly lower compared to subsequent years. Through 2021-2023, the total trips increased, with the total number being higher in each year compared to the previous. This trend correlates in general terms with lockdowns being lifted and COVID-19 vaccines becoming available. The first graph for CA shows a larger difference in total trips between different years compared to FL, and the total trips in 2020 were much lower than in 2023 whereas in FL, the total trips in 2020 were not as reduced compared to subsequent years, compared to CA. This difference in overall travel reduction between CA and FL could be indicative of policy differences as well as the public perception to the pandemic. (Bratic et al. 2021)
The Trends in Staying at Home in These Two Differing States
Contrasting COVID-19 Policies in California and Florida Drive Divergent Mobility and Staying-Home Accounts but Similar Trends.
California and Florida’s adoption of vastly different strategies to the Covid-19 Pandemic shaped how their populations responded to the crisis, particularly in terms of travel behavior and mobility.
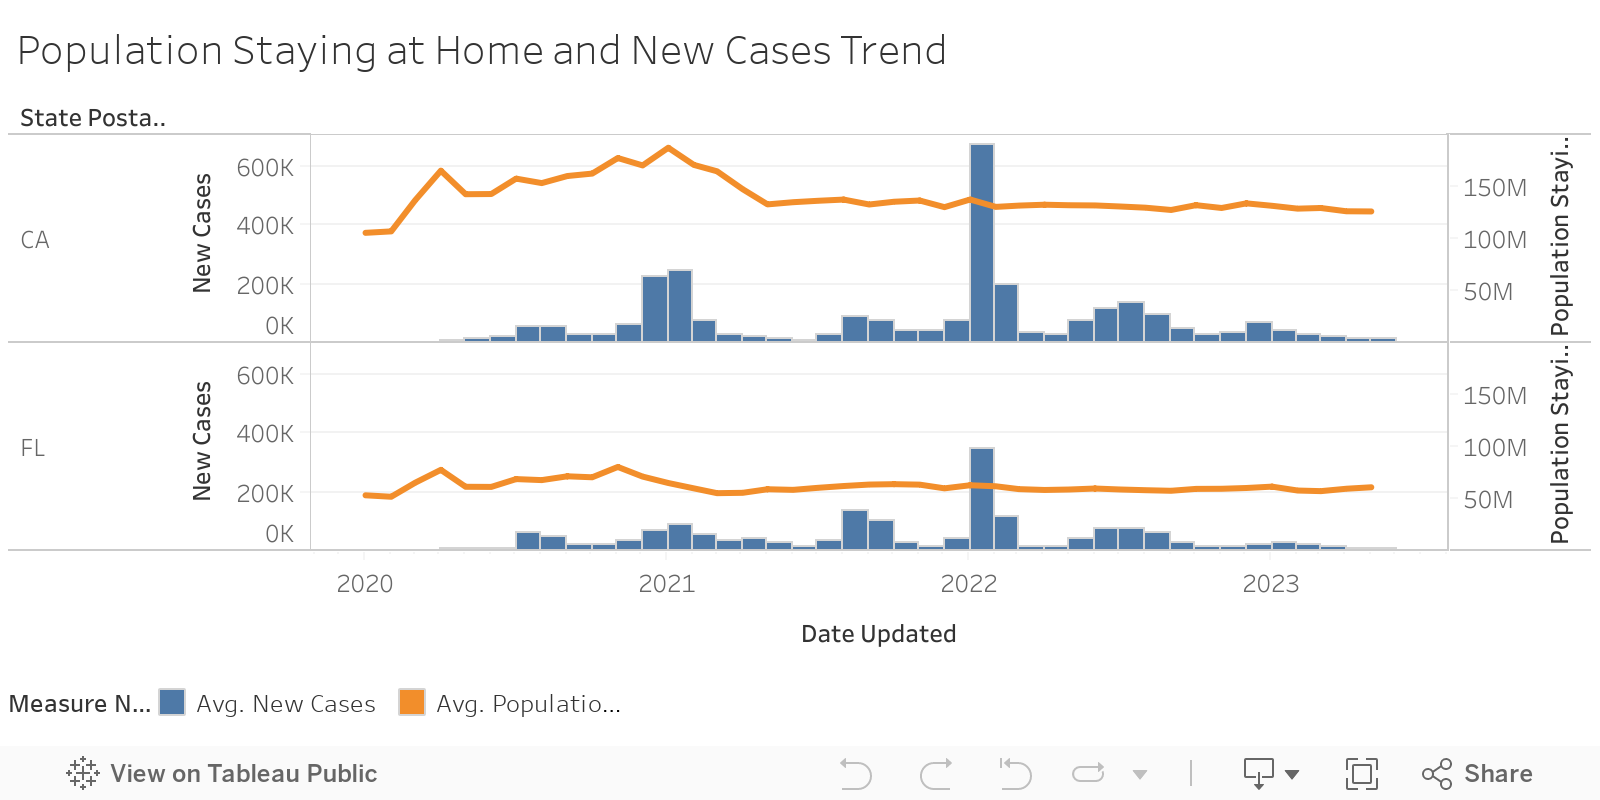
California, under Governor Gavin Newsom, prioritized public health, issuing the nation’s first stay-at-home order to curb the spread of the virus. Newsom’s approach was grounded in scientific data, with a strong emphasis on preventing overwhelming case surges. As shown in the dual combination chart, which tracks both new COVID-19 cases and the number of people staying at home, Californians demonstrated a strong sensitivity to rising case numbers.
The chart reveals that as cases spiked, the number of people staying home also increased, reflecting the public’s compliance with the state’s strict measures.
In contrast, Florida’s response, led by Governor Ron DeSantis, focused on preserving economic health and individual freedoms. DeSantis resisted lockdowns and vaccine mandates, advocating for personal liberty and keeping businesses open. This approach resulted in a more stable pattern of mobility, even as COVID-19 cases continued to rise. The dual combination chart highlights this divergence: while the number of people staying at home in Florida remained relatively steady, regardless of case surges, California’s population showed a more pronounced change in behavior, with greater mobility reduction during peak case weeks.
The differing travel trends between the two states reflect the underlying philosophies guiding each governor’s policies. California’s stringent public health measures, which prioritized safety and risk mitigation, led to more significant changes in population behavior, particularly in terms of reducing travel and staying home during surges. Meanwhile, Florida’s emphasis on economic stability and personal freedoms resulted in a more consistent mobility pattern, with fewer adjustments to rising case numbers. These contrasting strategies not only shaped the immediate public health response but also influenced the broader societal and economic outcomes in each state.(Lin et al. 2023).
The Travel Trends
Impact of COVID-19 Policies on Travel Behavior in California vs. Florida
The graph below displays the “Population Percentage Traveling” in CA and FL over time, highlighting the differences in state-level COVID-19 policies on travel behavior.
It can be seen in the graph that the differences in policies between California and Florida are reflected by the trends observed in the graph. The data reveals that CA consistently had a lower percentage of its population traveling compared to Florida during the observation period of Nov ‘19 – May ‘23. Early on in the pandemic in March-May 2020, CA implemented aggressive stay at home orders, which caused a sharp decline in travel, as demonstrated by the graph. On the other hand, Florida experienced a smaller shorter-lived dip, reflecting its relatively lenient restrictions.
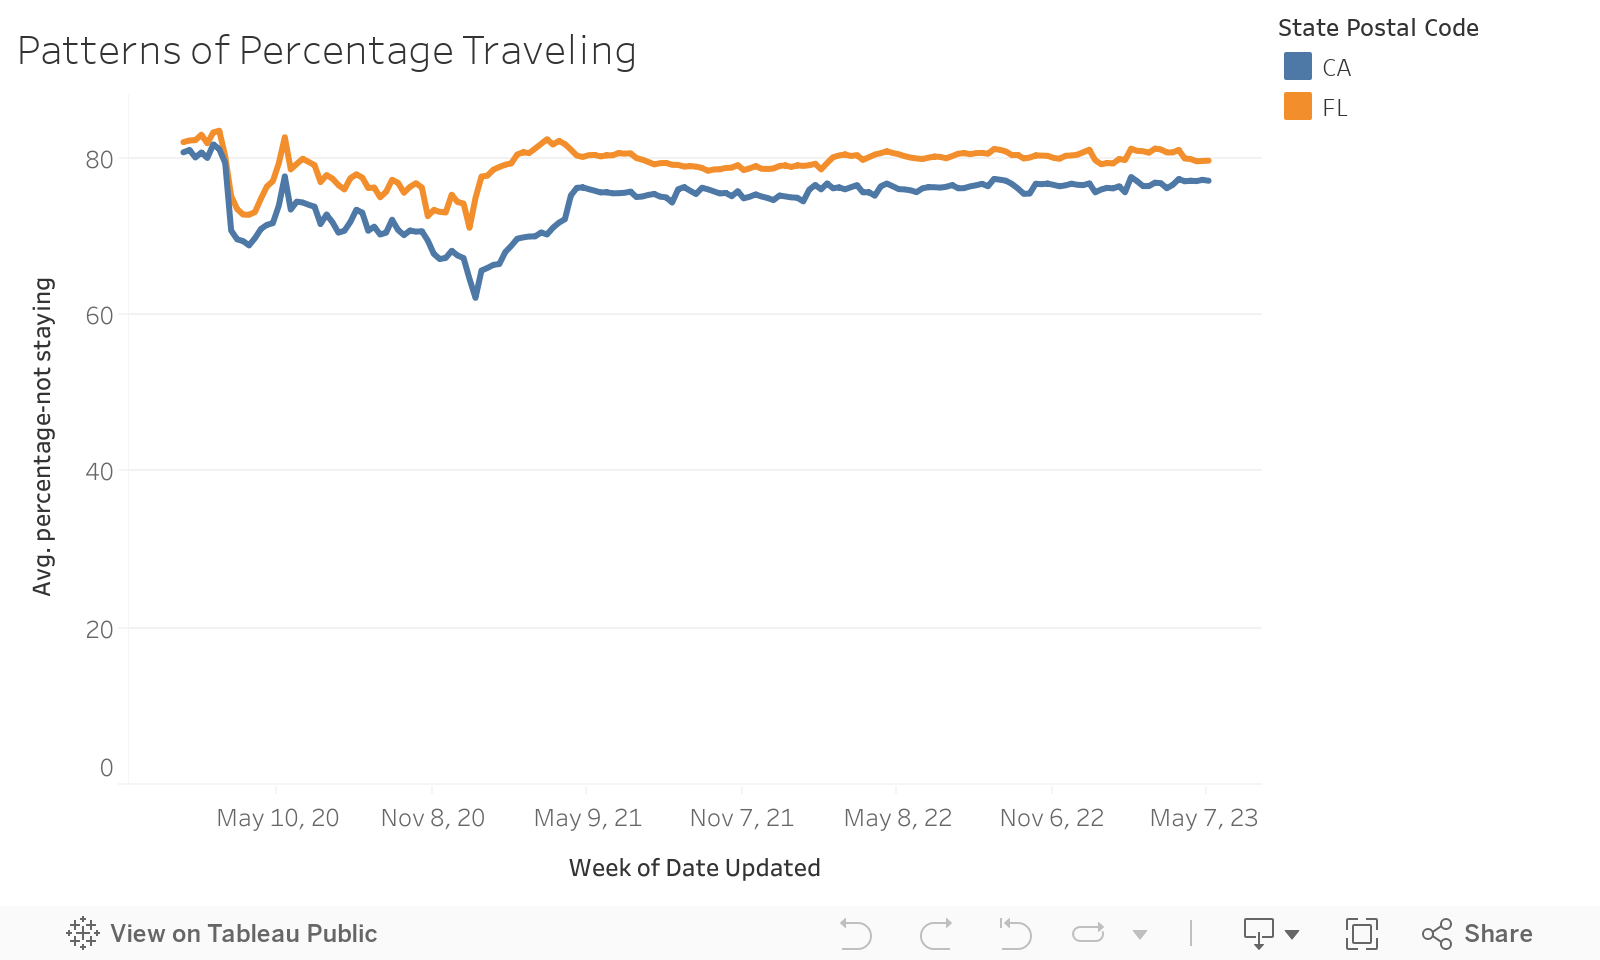
Over time, as the pandemic continued and restrictions eased, both states saw gradual increases in travel, but the gap between the two states persisted, with Florida consistently maintaining higher travel percentages, suggesting that Florida’s policies encouraged more mobility, even during peak pandemic periods, while California’s residents adhered to more cautious behavior, likely influenced by both government mandates and public health messaging.
California’s policies emphasized public health over mobility, which contributed to lower travel rates throughout the pandemic. This cautious approach likely mitigated the spread of COVID-19 but came at the cost of reduced economic activity, particularly in industries reliant on travel and tourism. Florida’s prioritization of economic stability over strict restrictions resulted in higher mobility but may have exacerbated COVID-19 transmission, as other studies have shown that increased mobility correlates with higher infection rates.
These differences align with broader debates about balancing public health with economic and social freedoms. California’s lower travel rates reflect a population adhering to stricter mandates, while Florida’s higher rates underscore the behavioral impacts of lenient policies.
A Glance into the Covid-19 Cases
We examined how California and Florida’s contrasting policies shaped travel trends in different ways. Despite these differences, both states followed surprisingly similar Covid-19 case trends over time.
Seasonal COVID-19 Peaks in California and Florida Present the Link between Travel, Vacation, and Public Health Policies
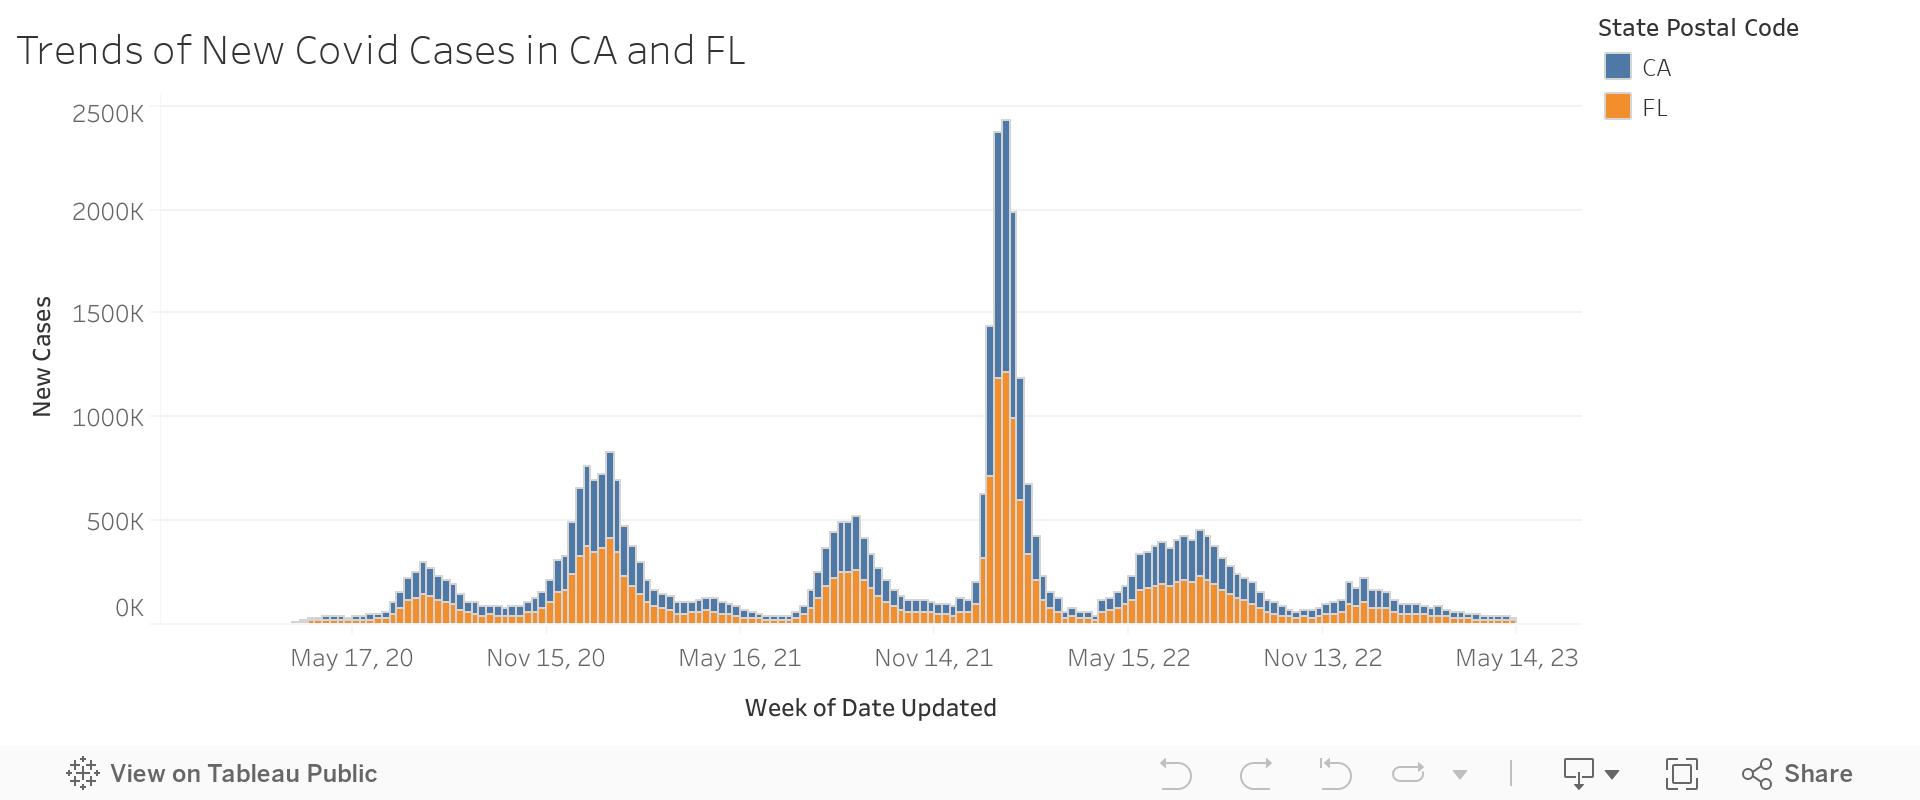
This visualization above reveals a recurring seasonal pattern of new COVID-19 cases, with significant peaks occurring annually between July to the end of August and between November to February. July to the end of August coincides with summer vacations, while November to February covers the end-of-year holiday season, including Thanksgiving, Christmas, and New Year’s Day, etc.
The increase in cases during these times can be attributed to California and Florida substantial tourism economies. Travel spending in the state reached an all-time high of $150.4 billion in 2023 (Office of Governor Gavin Newsom). In 2019, California generated nearly $145 billion in travel-related spending. Despite the sharp decline in tourism spending in 2020 due to severe restrictions, the industry demonstrated a steady recovery, with notable increases in both total visitor numbers and spending levels (California Chamber of Commerce).
Similarly, Florida’s tourism industry plays a crucial role in the state’s economy and job market. In 2022, travelers spent a record $124.9 billion. On average, visitors contributed $333 million per day to Florida’s economy (Florida Restaurant & Lodging Association). This underscores the popularity of California and Florida as vacation destinations, further explaining the surge in COVID-19 cases during vacation periods.
In addition, during the mid-2021 peak, Florida’s share of new COVID-19 cases exceeded that of California, corresponding to Florida’s early lifting of restrictions. The subsequent peak, where California accounted for a much larger share of new cases, illustrates the importance of travel restrictions in controlling the spread of COVID-19.
Notably, the peak in new COVID-19 cases was particularly pronounced from week 52 of 2021 to week 7 of 2022, which can largely be attributed to the easing of travel restrictions in both California and Florida. During this period, both states rolled back many of the public health measures that had previously curtailed travel, such as quarantine mandates and capacity limits for public spaces. As these restrictions were lifted, people were more inclined to travel, especially during the holidays, which traditionally involve gatherings, celebrations, and increased mobility.
The relaxation of these measures was likely seen as an opportunity by many to resume their pre-pandemic travel plans. The combination of pent-up travel demand, holiday season festivities, and reduced precautionary measures created a perfect storm for increased transmission of the virus, which aligned with the observed surge in COVID-19 cases during this period. The interplay of policy and covid-19 cases cannot be overlooked.
A Deeper look: Comparison of Per Capita Cases by County
We have seen California and Florida exhibit similar trends and relationships in travel patterns and COVID-19 rates during the pandemic but when analyzed at a broad level. However, zooming in on county level data from the peak of the pandemic paints an interesting picture of the difference in state level policies and their impact of tourism decisions to peak travel destinations. When we dive deeper, California and Florida weren’t as similar as they seemed with striking differences in how COVID-19 played out across their respective counties.
Stricter government policies in California reduced per capita cases in top tourism counties compared to looser economic focused Government decision in Florida
The maps above depicting Covid-19 cases per capita for the counties of California (left) and Florida (right) during a peak covid-period, reveal notable differences in how tourism travel influenced infection rates in these states. In California, high-tourist regions like Los Angeles and San Diego displayed relatively uniform infection rates with the rest of the state, with the range of infection rates for all counties being only 1% to 18%. This suggests that California’s strict public health policies and restrictions on travel and gatherings played a significant role in controlling the spread of the virus even in densely populated tourist destinations and the prioritization of public health over economic gain. Despite being major tourist destinations, these counties did not experience the disproportionate surges in cases that might have been expected, highlighting the effectiveness of the state’s efforts in reducing the spread of the virus. (Han, 2023).
In contrast, Florida’s map highlights higher Covid-19 rates in tourism areas like Miami and Jacksonville, with the infection rates in these regions being considerably higher than in less-visited counties. This aligns with research suggesting that tourist-dependent regions were more susceptible to public health challenges during the pandemic (Han, 2023). The higher infection rates in Florida’s tourist hotspots could be correlated to the state’s more relaxed approach to Covid-19 restrictions, which allowed for greater mobility and fewer restrictions on gatherings.The reliance on tourism in these areas likely made them more vulnerable to the spread of the virus, as the arrival of visitors and large public events led to higher exposure to the virus.
These maps emphasize how differing state policies and public health responses shaped the impact of tourism on infection rates. The contrasting patterns of Covid in California and Florida highlight the human impact of public health policies on vulnerable populations, particularly in tourism-dependent areas. While California’s strict restrictions may have protected its residents, Florida’s approach reveals how economic pressures can influence public health outcomes, greatly impacting tourism-dependent communities health.
A Closer look into Travel in 2021
Florida’s Relaxed Restrictions and Tourism Culture Drove Higher Per Capita Travel Compared to California in 2021
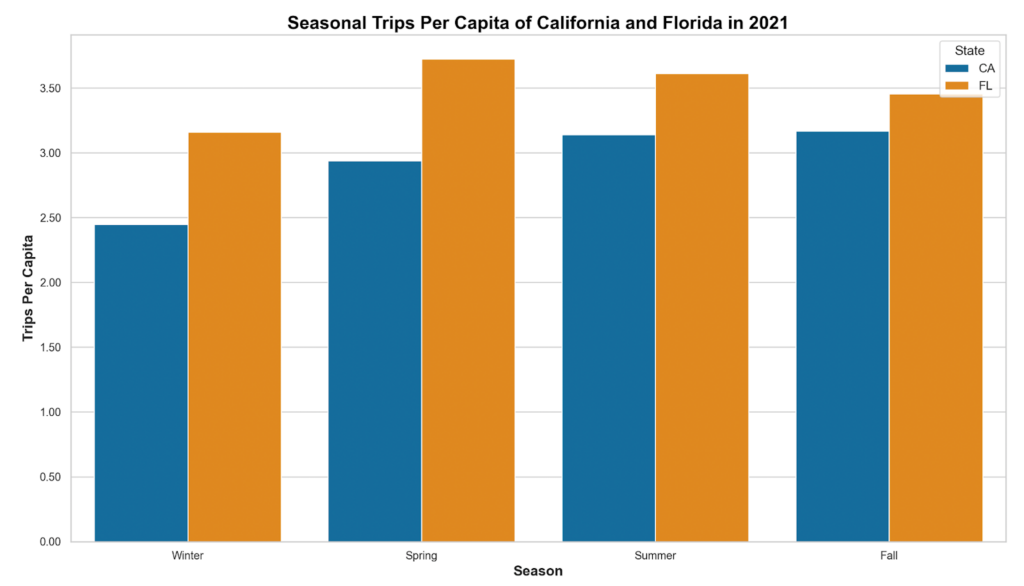
The graph displays a seasonal comparison of trips per capita between California and Florida in 2021 and highlights the differences in travel behavior between the two. Florida consistently outperformed California every season that year, suggesting a more active travel culture and or more relaxed travel restrictions for its residents. This trend is very apparent in Winter, when Florida’s more mild weather may have encouraged higher travel rates both locally and among tourists.
Spring and Summer also saw an increase in trips per capita in both states, most likely due to the traditional trend of seasonal vacation travel. However, Florida kept its lead, highlighting its strong appeal as a travel destination. During Fall, California experienced a decline in trips per capita, whereas Florida kept steady, illustrating is consistent year-round travel culture.
The Covid-19 also played a significant role in the travel patterns illustrated by the graph. Florida’s more relaxed pandemic restrictions may have contributed to its residents’ higher travel rates. As explained by Findings(2022), “The Southern US was less impacted by COVID-19 compared to other regions, possibly due to the looser mask-wearing restrictions” (Huang et al., 2022). This relative freedom is what likely encouraged more mobility and travel. Additionally, Florida’s economic recovery and tourism-focused initiatives, such as the “One Florida-One Goal” campaign, played a key role in sustaining high travel activity (Rivkees, 2024). On the other hand, California’s larger population and stricter public health measures possibly lowered its per capita travel. The stronger recovery from Florida aligns with the trends showing Southern states generally experienced less disruption in travel trends compared to other regions (Huang et al., 2022).
Florida’s consistent lead in trips per capita throughout 2021 is an accurate representation of its robust travel culture and relaxed travel restriction especially during the pandemic. While in contrast, California’s strong Covid-19 policies and higher population provide reasonable cause for the lower travel per capita during the pandemic. These factors, coupled with regional and political differences in pandemic impacts, stress the disparities in travel behavior between the two states.
What our Research Found:
Policy Differences and Public Response
The differences in travel reduction between CA and FL reflect policy differences and public response to the COVID-19 pandemic. There is indication that policy differences may have played a significant role in travel reduction, as CA Governor Newsom’s approach focused on public health, whereas FL Governor DeSantis avoided lockdowns and vaccine mandates, advocating instead for individual freedoms despite the rise in COVID-19 cases that FL experienced. It is important to note that CA’s population is almost double that of FL’s at 39.4 million in 2020 vs FL’s 21.7 million. CA’s population also has an average age of 5 years less than FL’s. Our research focuses on case rates per capita to avoid bias due to population size differences and to ensure a fair comparison of the impact of policies and public behavior on the spread of COVID-19.
Comparative Travel Reductions
The comparative reduction in the number of trips taken in each state is of particular interest to our research, keeping in mind the large difference in population. In 2020, the total number of trips taken in CA was approximately 13.5 billion whereas that number was approximately 8.5 billion in FL, indicating that CA was able to lower travel more effectively than FL due to lockdown restrictions. In 2022, there were approximately 17 billion and 12 billion total trips taken in CA and FL, respectively. Thus, the overall reduction in trips in CA was greater, proportionally to its population. This suggests that California’s stricter lockdown policies and public health measures had a pronounced impact on reducing travel compared to Florida’s less restrictive approach.
Tourism’s Role in COVID-19 Spread
Tourism is a significant factor in the spread of COVID-19, especially in CA and FL, both of which have high levels of tourism year-round. In 2019, the year prior to the pandemic, CA tourism spending reached a record high of 150.4 billion USD, while FL was not far behind at 96.4 billion USD, indicating that FL has much higher tourism levels compared to its population. Then, in 2020, tourism decreased by 36% in FL, while CA’s decrease was much higher at 59%. Interestingly, our research found that counties with high-tourist destinations including Los Angeles and San Diego counties in CA did not have higher case rates, and even FL counties like Miami-Dade and Orlando had only marginally higher rates than other counties. This suggests that while tourism contributes to population density and mobility, its direct impact on case rates may be mitigated by other factors such as public health policies, local adherence to safety measures, and the demographic characteristics of tourists and residents. For example, stricter mask mandates, vaccination efforts, and testing protocols in tourist-heavy areas could have played a role in preventing higher case rates despite increased exposure risks. Additionally, the marginal differences in case rates across counties highlight the complexity of transmission dynamics, where factors such as socioeconomic conditions, healthcare infrastructure, and population density may interact with tourism to influence outcomes.
Impact of Holiday Travel
One of the most significant factors in case rate increases appears to be holiday travel. Our research found that the largest spikes in cases were immediately following Christmas and New Year holidays in January 2021 and January 2022. Furthermore, case rates increased significantly during the summer months in both of these years. This pattern suggests that increased mobility and social gatherings during these periods contributed to higher transmission rates. The combination of family gatherings, travel, and relaxed adherence to public health measures during holidays likely created conditions conducive to widespread virus spread. Summer increases may reflect both domestic travel and large-scale events, such as festivals or vacations, where distancing and masking were less consistently practiced. These findings highlight the critical need for targeted public health messaging and interventions during predictable periods of heightened activity to mitigate surges in case rates.
Insights on Public Health Policies
The analysis of travel behavior and COVID-19 trends in California and Florida shows how public health policies interact with human behavior, societal values, and economic priorities. California’s strict policies put safety and collective well-being at first, indicating a willingness to sacrifice mobility for the greater good. In contrast, Florida’s focus on economic stability and personal freedoms exposed vulnerabilities in tourism-dependent areas. These different policies again emphasize the political and cultural divides while showcasing humanity’s adaptability and the complexity of decision-making during crises. Ultimately, public health challenges reveal deeply human experiences shaped by our values and priorities.