Our Data
Trips by Distance | BTS Data Inventory
- Dataset Overview
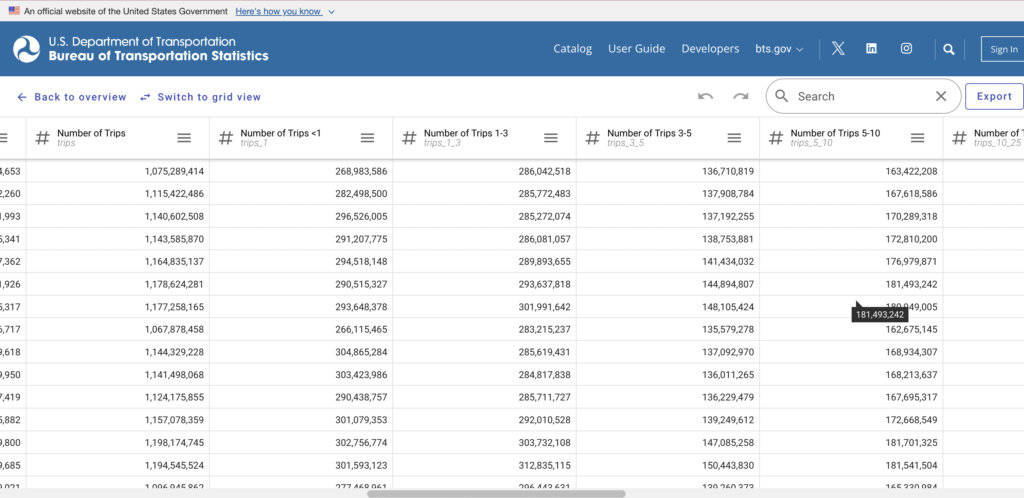
The dataset “Trips by Distance,” provided by the U.S. Bureau of Transportation Statistics, offers detailed information about travel distances in the U.S from January 2019 to 2024. It includes key fields such as trip distance which describes the distance of each recorded trip, categorized into different ranges, geographical location which indicates the place that people are taking trips, number of people staying at home, and those traveling.
- Data Source and Processing
The data used in the “Trips by Distance” dataset was generated through the Bureau of Transportation Statistics (BTS) mobility statistics program. The Bureau of Transportation Statistics is a US government entity funded by the US government. The data source is an anonymized national panel of mobile device data, provided by multiple sources, and processed by the Maryland Transportation Institute and the Center for Advanced Transportation Technology Laboratory at the University of Maryland.
- Insights into Travel Patterns
Travel statistics were produced by analyzing anonymized location data from mobile devices, which capture movements away from home. Travel behavior is inferred from location data, where any stay of more than 10 minutes away from home counts as a trip, and multiple stops before returning home are treated as separate trips. A multi-level weighting system ensures the data is representative of the population, accounting for geographic and temporal variations while preserving confidentiality by excluding counties with fewer than 50 devices.
This dataset can provide insight into travel patterns by identifying the most common travel distances and modes of transport across different regions. It can help differentiate urban versus rural travel behavior, potentially shedding light on lifestyle shifts during the pandemic. Differences in location could also be reviewed for potential insights into policy differences between states and metropolitan areas, differences that could, of course, also be explored for their impact on travel. Travel variations between such geographical locations could also lead to questions about public transportation and its relation to disease spread and case handling. The data covers from 2019 up until late January 2024, so all of these dynamics related to the COVID-19 pandemic can be explored in comparison to times before as well as after the pandemic.
- Dataset Limitations
However, the dataset has notable limitations. It does not provide information such as personal travel reasons, expenses, or specific transportation modes. Additionally, it lacks demographic information like income, age, or ethnicity, so the data set will not provide insights into social or economic differences in traffic behaviors. It also does not distinguish between business and pleasure travel, nor does it provide data on emissions and other environmental impacts. These omissions restrict the set’s applicability in exploring particular lifestyle dynamics during the pandemic and their relation to the spread of COVID-19. To address these gaps, integrating other data sets, such as those related to COVID-19 cases or demographic factors, could allow this data set to provide further humanitarian insights. Ideologically, the data set is statistically-focused and it alone cannot answer many broader questions about the pandemic’s impact on travel, policy effectiveness, or social justice. The data set is limited to travel distance statistics, so it in itself does not provide any basis for a particular ideological approach to analyzing travel during the pandemic. For a more comprehensive understanding of travel during the pandemic, this set would need to be supplemented with additional data on health outcomes, demographics, or environmental factors.
- Dataset Overview
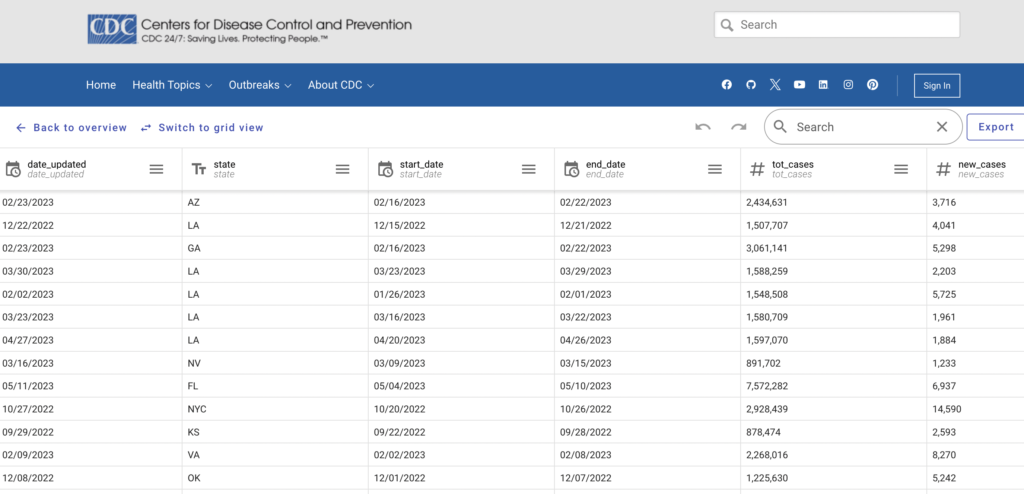
The dataset “Weekly United States COVID-19 Cases and Deaths by State – ARCHIVED” provides cumulative and new weekly COVID-19 cases and deaths for each state and U.S. territory. It covers data from January 23, 2020, to May 11, 2023, marking the expiration of the COVID-19 public health emergency declaration. A final update was made on June 1, 2023, reconciling historical data through May 10, 2023. The data is publicly available for analysis and historical review.
- Data Source and Processing
The data for the “Weekly United States COVID-19 Cases and Deaths by State” dataset was collected by the Centers for Disease Control and Prevention (CDC) from state and local health jurisdictions. The CDC’s data team reviewed and validated the data daily, sourcing information from state and local health department websites. When multiple official county data sources were available, the CDC used the highest reported case and death counts unless otherwise specified by the jurisdiction. County-level data was then aggregated to provide state-level totals, reflecting a collaborative effort between the CDC and jurisdictions to ensure accuracy. Retrospective updates were made as needed to correct errors and maintain data quality.
Over time, there were changes in the dataset’s methodology and update frequency. Initially, updates were made twice daily; however, this was later adjusted to weekly updates. Additionally, the dataset transitioned from daily state-level data to weekly aggregate data, consolidating historical counts of confirmed and probable cases into “Total Cases” and “Total Deaths” columns for simplicity and consistency.
- Insights into Data
The dataset includes weekly counts of new and cumulative COVID-19 cases and deaths, reported by jurisdiction, encompassing 50 states, U.S. territories, and compact nations, covering a total of 60 public health jurisdictions. This structure allows for the analysis of temporal trends, enabling researchers to track the spread and severity of the pandemic over time. In our project we would focus on California and Florida. The dataset provides valuable insights into the progression of COVID-19 at the state level, helping to identify patterns in disease spread, assess state-level public health responses, and explore correlations between case and death counts and policy measures. It is particularly useful for comparing the pandemic’s impact across states and evaluating changes in case counts before and after policy interventions or during specific periods, such as holidays. Temporal trends in the dataset reveal spikes in case and death rates during holiday periods or following reporting backlogs. Additionally, variability in reporting cadence and historical corrections highlight discrepancies in case and death counts between jurisdictions and timeframes, emphasizing the need for careful interpretation of the data.
- Dataset Limitations
The dataset has several limitations that affect its reliability. Gaps in reporting occasionally occurred when jurisdictions failed to submit data, resulting in discrepancies in weekly counts. Data inconsistencies also arose from changes in reporting patterns, particularly during holidays or due to technical issues. Additionally, the dataset excludes important demographic details such as age, gender, race, or underlying health conditions, as well as specific indicators like hospitalizations, recoveries, or outcomes beyond death counts. It also lacks data on individual cases, including vaccination status and if they had other illnesses at the same time. This would limiting its ability to provide a complete picture of the pandemic’s impact. Accuracy issues further complicate the dataset, with discrepancies between state and county reporting systems causing inconsistencies in case and death counts. Backlogs of historical cases or deaths inflated numbers for specific weeks, making trend analysis more challenging. Furthermore, methodological and time related differences, such as the transition from daily to weekly updates and the inconsistent distinction between confirmed and probable cases in the later dataset, reduce the precision and consistency of the data.
- Methodology for Dataset Integration
We will merge the two datasets by consolidating both datasets to be per month and per state. We will use the new cases and the cumulative cases columns from the COVID dataset to enhance the transportation dataset and draw conclusions from the merged dataset.